Videos and user manual > 2.7. Polygraph
This screen mainly uses academic biomarkers.
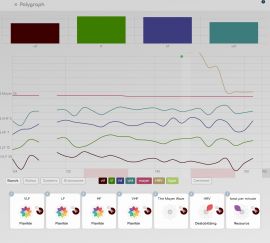
It provides a convenient way to see in a glance e.g. the VHF, HF, LF and VHF proportions, and a linear graph of up to 7 important curves.
This can be used in real time during recording, as all screens (just switch screen during a recording). All these markers come from the academic research on ECGs. You can display up to 7 bands of your choice, in parallel or centered on the same line.
If you do research with this graph, it could be the basis for new insights or new biomarkers. In addition, remember you can analyse any biomarker in its timeline and with events on the biomarker Dynamics screen.
- In Bands mode, the 7 lines are: Bpm, HRV, Mayer waves, VHF, HF, LF and VLF.
- In Ratios mode, the 7 lines are: SDNN (Total power), SI (Stress index), IC (Index of Centralisation), LF/HF (Power, vago-sympatethic interaction), LF/VLF (Relax), VLF/HF (Stress) and VLF+HF (Global activity).
- In Systems mode: CNS, Ortho, Symp, Para, IRSA, Immunity, HRV.
- In Brainwaves: Delta, Theta, Alpha, Beta, Beta1, Beta2, Gamma.
Click on a category under the graph to show these items; click on the items colored legends to show or hide them. Click on Centered to show the all on the same baseline. Click on the flower under the graph to access the full biomarker details.
|
|
>> Next chapter: 3. Understand: Energy
|