Modules overview > 1.1. Time graph module
See how a biomarker evolves over time and sessions.
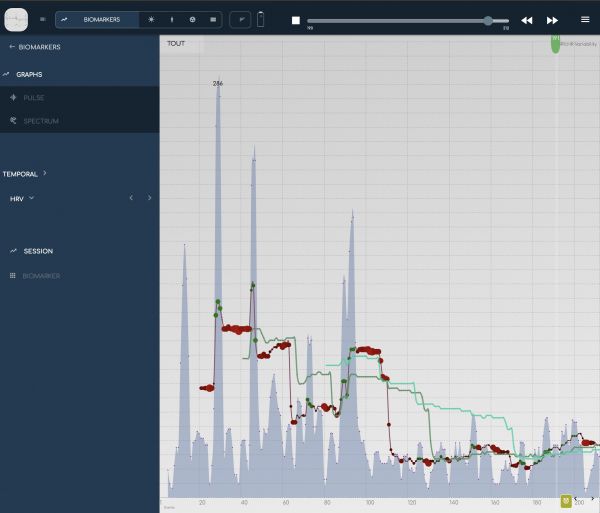
BioCoherence works with biomarkers in a very dynamic way, assessing their evolution over several timeframes and comparing them across timeframes.
- On this graph, each biomarker is shown at the beat level, compared to the short-term, medium-term and long-term moving averages.
- You can move inside the recording with the top scroll (press the Play button to display it; press the Stop button to compare across sessions). You can also click in the graph to move the current mark.
- You can change the zoom scale with the top-left range selector.
- You can work with events on this module: the events are displayed on the bottom of the graph. To create or edit an event, click on the button on the bottom of the graph.
|
|
>> next: 1.2. Biomarker module
|