Vista general de los módulos > 1.1. Módulo de gráfico temporal
Vea cómo evoluciona un biomarcador a lo largo del tiempo y de las sesiones.
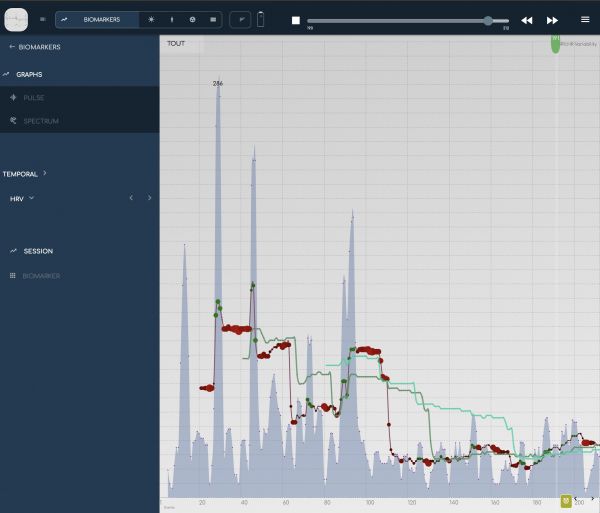
BioCoherence trabaja con biomarcadores de forma muy dinámica, evaluando su evolución en varios plazos y comparándolos entre sí
- En este gráfico, cada biomarcador se muestra a nivel de latido, comparado con las medias móviles a corto, medio y largo plazo
- Puede moverse dentro del registro con el desplazamiento superior (pulse el botón Reproducir para visualizarlo; pulse el botón Detener para comparar entre sesiones). También puede hacer clic en el gráfico para desplazar la marca actual
- Puede cambiar la escala del zoom con el selector de rango superior izquierdo
- Puede trabajar con eventos en este módulo: los eventos se muestran en la parte inferior del gráfico. Para crear o editar un evento, haga clic en el botón situado en la parte inferior del gráfico
|
|
>> siguiente: 1.2. Módulo de biomarcadores
|