Wow! but how?
How BioCoherence Technology Works
Wow! But how? This is the main question new users ask after their first scan.
Let me explain in simple terms. If you prefer going deeper, there is a more in-depth explanation after this.
Quick explanation
From Raw Recording to Insights
BioCoherence starts with an ECG (electrocardiogram) recording, using a medically-certified sensor. While primarily recording the heart's electrical activity, the sensor also captures the electrical activity of the entire body, from left finger to right finger. This comprehensive data shows up as the main ECG recording, dominated by the heart's rhythm but also displaying other subtle electrical activities.
Data Processing and Analysis
Raw Data to Features: The initial ECG recording includes both the main heart rhythm and other electrical frequencies. Automatic filtering excludes problematic beats (e.g., due to movement), allowing for accurate analysis.
Multi-Level Analysis:
- First-Order Analysis:
- Extracts primary data from the ECG, such as specific frequencies (VLF, LF, HF) and time-based intervals (HRV).
- Uses extensive published research to derive academic biomarkers.
- Second-Order Analysis:
- Analyzes the first-order data to uncover new properties, such as harmonics and entropy.
- Calculates additional biomarkers infos, including qualities like attention and intent.
- Third-Order Analysis:
- Identifies links and resonances between elements, showing energetic relationships (e.g., between organs).
- Uses complex algorithms to calculate TCM recipes and linked elements.
- Fourth-Order Analysis:
- Computes resources and priorities, indicating which biomarkers are most significant.
- Integrates findings into a coherent overview of the user's health.
User Benefits:
- Scan Module: Provides detailed biomarker analysis, body maps and graphs.
- Test Module: Offers real-time biofeedback and an open creation system.
- Balance Module: Generates custom meditations and reports.
Day-to-Day Value: Focuses on higher-order information (resources, priorities) that offer the most practical insights for users, while still allowing access to all detailed data.
In conclusion, BioCoherence uses advanced mathematical algorithms to transform raw ECG data into valuable health insights, offering a multi-level analysis that reveals comprehensive information about the body's electrical activity. This innovative approach provides users with actionable data to enhance their well-being.
In-depth explanation
Let's dig in-depth... I will try and answer as deeply as possible without entering technical grounds...
In the beginning was the raw recording
 BioCoherence starts with an ECG recording. ECG stands for « electrocardiogram » which means we use a medically-certified device (our Sensor) that is primarily meant to record the heart's electrical activity. But, there is a catch: the heart is the most powerful, but is not the only organ in the body to have an electrical activity. We know the brain does (it show on an EEG, an electroencephalogram), but in fact, every organ, every atom, every system has a magnetic and electrical activity. As we measure from left finger to right finger, the sensor records a lot more than just the heart's beat rate impulse: it records the whole body's magnetic and electrical activity.
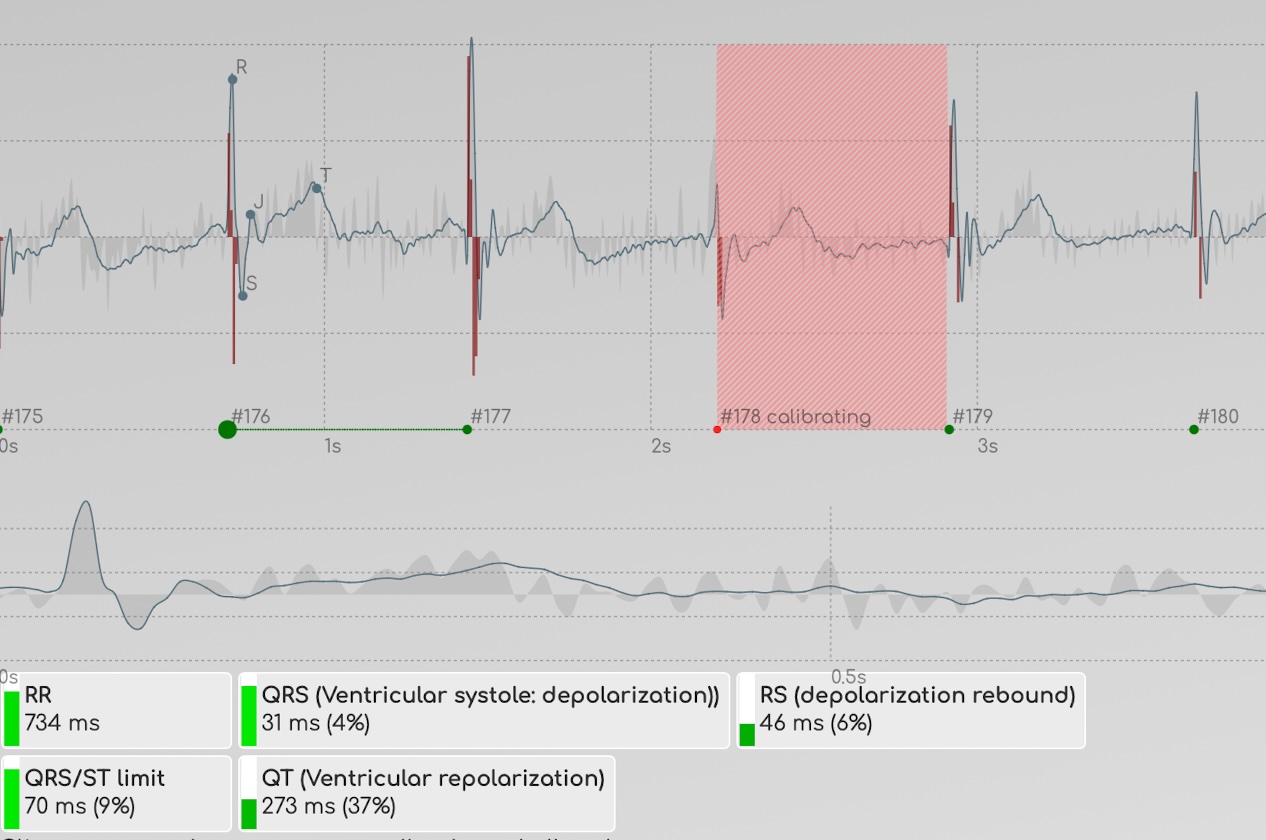
So, the first thing we have is a lot of electrical information, which shows as the main ECG recording. This is clearly dominated by the heart beat's main rhythm, but there are a lot of things going under this main activity, and it shows in BioCoherence as the gray line vibrating around the main wave. This is where we will find data to rebuild thousands of biomarkers's activity.
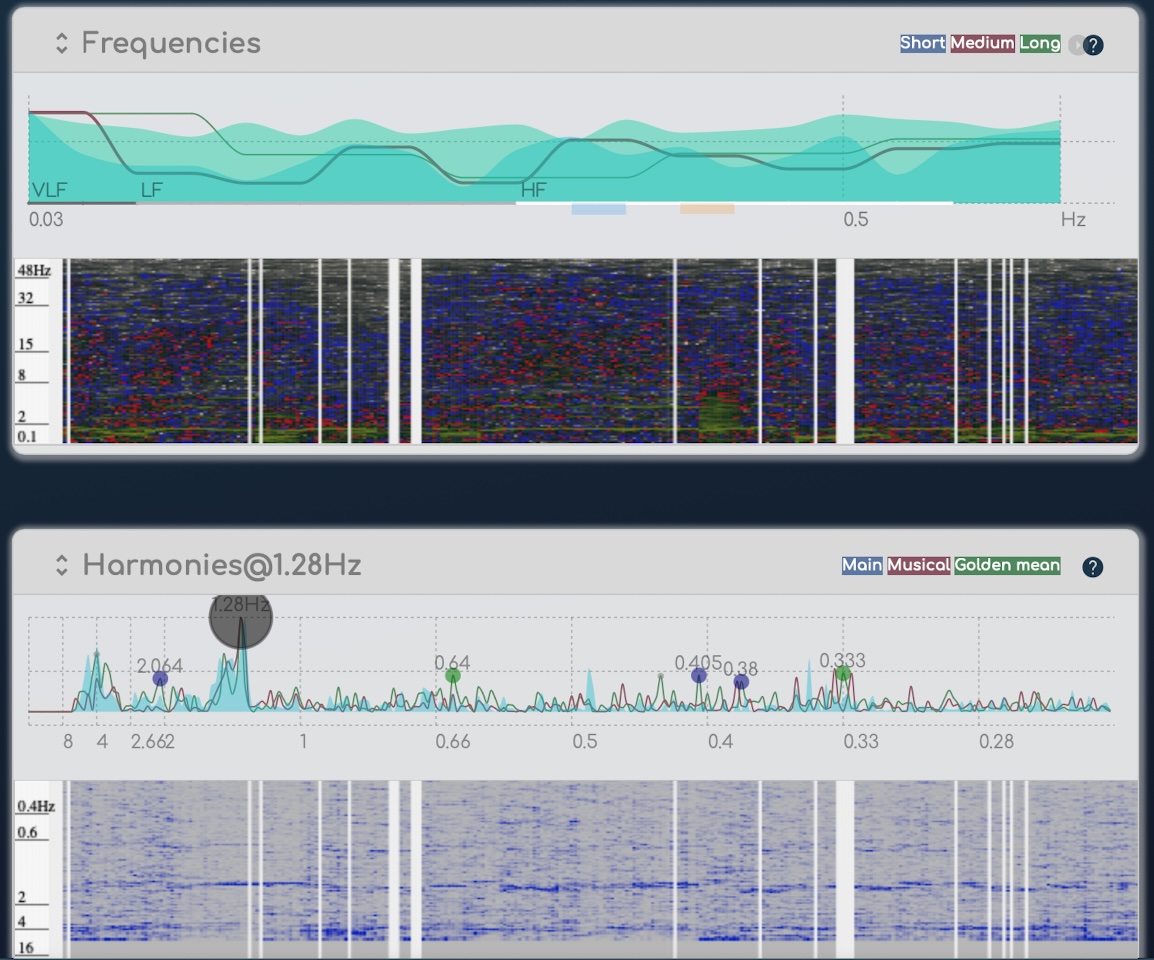
You can see it on the frequency pages: near the bottom of the frequency graph you always have a dark line which is the most important frequency (the beat rate) but you can also see a lot of other frequencies present in the recording. This frequency graph is another way to see the recording wave, by transforming a time-based information into a frequency-based graph; but this is still the same raw information.
We added some automatic filtering to exclude the beats that are problematic (because, for instance, the user moved and the electrical signal was off the charts for a few seconds), and at that point, we can start analysing this recording to extract features.
Emergent properties
In systems theory, there is an important concept called « emergent properties ». To be brief, it states that, with each new level of complexity appear new properties that are not directly derived from the properties of the lower level. For instance, you can mix 2 highly flammable gases (oxygen and hydrogen) and get a stable liquid (water) that has properties impossible to guess from these gases. This is why we do a multi-level-order analysis, each level using the properties of the former level, and each level uncovering new relationships that could not be existing on the former level.
All of this is made purely with mathematics. Contrary to the majority of other « energetic assessment devices » that are mostly based on random-number generators, the algorithms in BioCoherence are purely based on maths, and so the results will always be exactly the same for a recording. In fact, the whole calculation is made again each time you open a recording.
Then comes a first-order analysis
 Now, our algorithms will do a first-order analysis on this raw data, to extract first-order information. This can come, for instance, from specific frequency or frequencies ranges (like for VLF, LF or HF) or time-based interval analysis (like for HRV).
We used a lot of published research by a very wide variety of ECG researchers that don't usually speak together to come up with wide lists of informations that we extracted at this level.
This first-order analysis gives un mainly the academic biomarkers, as this is usually where official researches stop. This is because signal processing is usually quite limited in medical research*, whereas I applied musical signal processing which is far more advanced. As DSPs (digital signal processors) replaced analog treatment in music since the 90s, an enormous amount of research has been done to understand, emulate and process digital recordings with many tools like sound effects or various tools to adjust a digital musical content in real time. This is basically the same algorithms that we use in BioCoherence: advanced maths that sound engineers know in music processing but nobody uses in medical applications.
*: on a side note, everybody jokes that a peer-reviewed paper was published in 1994 explaining a very novel method to calculate the area under the curve (pompously called AUC) of an electrocardiogram. This was deemed sufficiently interesting to be published in a peer-reviewed journal. But, as anybody with a bit of math training knows, this is called an « integral », is learned in college, and has been discovered many centuries ago. Nonetheless, most official research is on this level of maths.Things start to be interesting in second-order analysis
 Once we have this first-order data, we get new properties and we can do several second-order analysis on these new properties. For instance, as a first-order analysis we calculated a spectrum: thanks to a mathematical algorithm called an FFT (Fast Fourier Transform), we can display the raw recording as frequencies instead of a wave. Now, In a second-order analysis we will calculate a Cepstrum (which is a 2nd order FFT) that allows us to extract not the frequencies, but the harmonics in the signal: in a word, it extracts the frequencies that resonate harmonically together. Using these results, we will the obtain some new biomarkers.
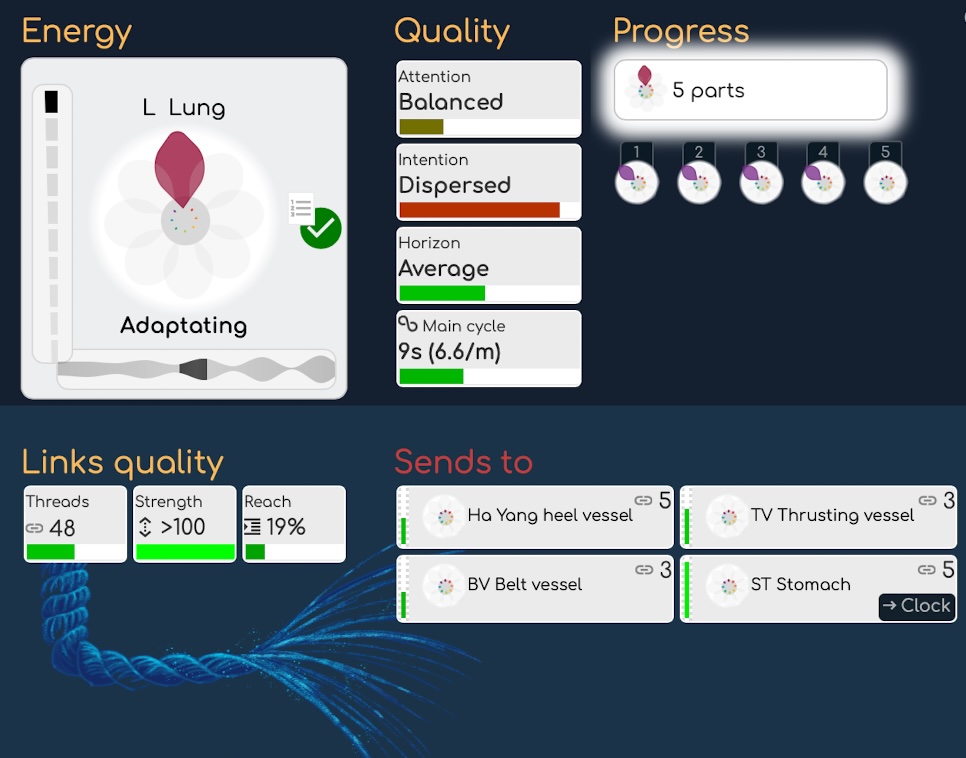
- An example of another 2nd order analysis is the calculation of entropy (or « agitation ») of each biomarker. In a word, it shows how a specific biomarker is static or agitated.
- Another examples of 2nd order analysis are the qualities we show of the right of a biomarker, like attention, intention and horizon (properties extracted from their musical qualities), and main cycles.
There are many 2nd order analysis done on the signal, and so we obtain many new biomarkers informations. But we will not stop here, because this new level uncovers some new interesting properties that did not exist before.
Again, we used a lot of published research by a very wide variety of researchers, now not on ECG data, but on therapy-specific data like Ayurveda, TCM, energetic assessment or modern medical science.
A third-order analysis: links and resonances
 Now comes another level of complexity with its new marvels. Using all the 2nd order new data we have, we can calculate new properties, as for instance, links between elements. These links are shown everywhere in the app, like on graphs or body maps; they allow us to understand the main energetic relationships between, say, organs: if an organ is linked to another, it can indicate there is an energetic transfer in place, and one is helped or helping the other.
These links are computed with a fairly complex multidimensional algorithm that uses advanced vector maths to extract common resonances between elements. But we tried to hide this complexity and render only the result, which are clear links between the elements.
- As part of the process, we calculated tons of data and it shows as « link qualities » and linked elements for each biomarker.
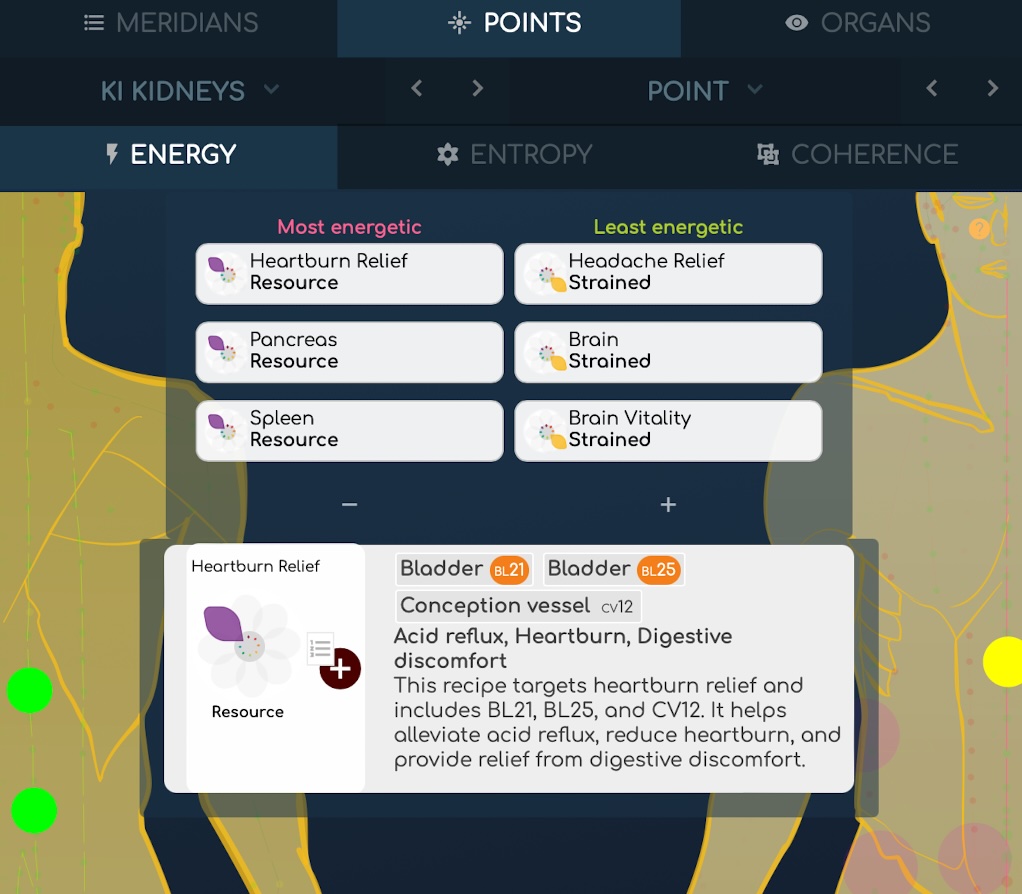
- Another 3rd order example is the computation of TCM recipes. We reverse-engineered the TCM recipes logic, that uses several acupuncture points to cure specific symptoms. By reversing it, we say: if these points are linked by these 3rd-order properties, it might indicate the associated symptom of their group.
Again, we used published research on therapy-specific data. Apart from TCM recipes, the links logic come from the work of many practitioners we worked with, that try and go up the causal chain to find root causes.
Why not go further?
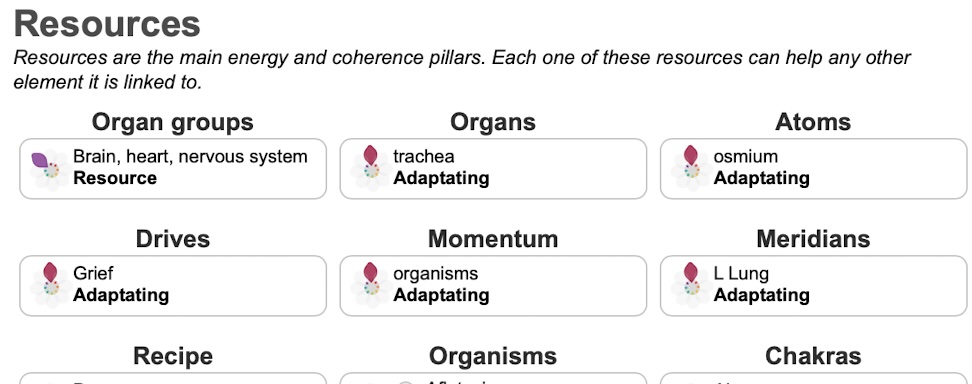 OK, while we are at it, let's continue with these new emergent properties, and do a 4th level analysis. With all these new data points, we can now calculate resources and priorities. Resources are calculated by a 4th-level algorithm that uses information from all below levels to compute a single « resource value », as shown on the resources page (when you click on a resource to change it if needed). It indicates how a biomarker in a given family is « at the top of the generosity chain ». The resources theory comes from Christine Degoy's work and is much more explained in her forthcoming books.
Priorities, on another hand, are somehow the underdogs, the « bottom of the food chain » parts. They are extracted from 3rd-order informations and below, according to energy, agitation or coherence in a given biomarker family. As we computed energy, agitation and coherence, we can now put as priorities the too low energy, too high energy, too static and too agitated elements, and also the coherent systems that might indicate something is going on.
And now, let's dance in reverse
Let's go back to our H2O water example. When you first see water, you don't analyse it from its gaseous components. You only see the top-level-order properties: that you can drink it; that you can swim in it; that it can mix with other elements, etc. Usually when we see a complex system, we see it from outside and we only see the top-level-order properties. And, each time we uncovered an additional level of order, we realised how useful it was for everyday users. So, in BioCoherence, we tend to reverse the importance of the information and start with resources (a 4th order information), priorities (a 3rd order information), biomarker flower (a 2nd order information) and biomarker qualities (a 3rd order information). It is still possible to go down to the first-level order information (the wave and spectrum) but what brings the most day-to-day value are the upper levels.
 The complexity orders are shown through the top right arrows on the home screen (they can be clicked to redo the math at each level), but the menu logic (and the report order) is reversed: it starts with the upper levels (balance: resources, priorities and report) as this is usually the most important information to start with.
And that's all for the scan part.